In the Call for Posts to this latest edition of the Accretionary Wedge, Anne asked:
"What should you and I and other geosciences profs be doing better?"
In graduate school, I took some really sweet courses - like Igneous Petrogenesis from Calvin Miller (at Vanderbilt), and later Tectonics from Rob Van der Voo and Metamorphic Petrology from Eric Essene (both at Michigan). These courses were fun and memorable, challenging yet enjoyable, and above all, made me think critically about the topics at hand. There were a number of others too.
And then there were the OK ones, the so-so ones, and the awful ones, and I won't name names. I knew I wanted to be a professor when I got out, and I knew, as everyone does, that there are professors who are good teachers, and there are those who are in-between, and there are those who need to be encouraged to find another profession. And I would be one of the good ones, right?
I'm in my 8th year as a professor now since leaving UM. The one thing I've learned clearer than anything, is that graduate school does not prepare one to be a good instructor. At all. I realize now how very little I knew about how people learn. Spiraling? Student Learning Outcomes? Scaffolding? Pedagogy? Bloom's Taxonomy? Cognitive, affective, and psychomotor domains? Assessment? Goals and objectives? I hadn't really heard of any of those terms. I was in training to become a professor, a job that at least in part involves teaching, but I hadn't even heard words of the language spoken by those who understand the literature on how to teach well. Graduate school does not prepare faculty to be good teachers, at least not intentionally.
In my early years as a professor, I absolutely couldn't understand why some of my students struggled so much to learn. Because I did some things really well. A lecture, now that I can deliver, with schnazzy, well organized powerpoint slides, numerous examples, interesting sidenotes, a couple of breaks for questions & discussion, and even a joke or two that drew actual smiles.
But here's what every professor needs to know: of that fantastic 50 minute lecture you just gave, the one you spent 2 full days preparing, organizing, scanning your old field photographs for examples, sifting through textbooks to find the right figures, and all of that - of that 50 minutes where you deliver a great lecture, students might retain about 10 minutes.
10 minutes?!!? Are you kidding me?!??! Unfortunately, no. Now, most of us professor go "now wait a minute, I got a whole lot more out of lectures than that!" Yes, you did... and that's why, today, you're the professor. But unfortunately the research shows that most people do not learn well from lectures. That's something I never learned as a student. But in my role as a teacher, this point has become crystal clear - for most students, lecture is largely a waste of time, even the good ones!
One concept that has revolutionized my teaching for the better is the realization that if students don't actively use the information being communicated to them, they won't really assimilate it or retain it. I've seen it many times now in the past 7+ years - I'll give a good lecture, students will comment that they learned the material, and we both feel good about what went on in that time we spent learning new concepts - but then I give them some problems to solve, or an activity to do, and they suddenly have tons of questions! They may have thought they understood a concept, but now having to apply it they realize they don't get it like they thought. Questions they didn't know to ask, now start coming out. These are the moments when they are really learning! All of us learn through our experiences, experiences that require us to overcome something, solve something, find a new way around something, etc. No one learns to ride a bike by sitting and listening to someone talk about how to ride a bike. You learn to ride a bike by getting up on that bike and trying to ride it - and you fail the first few times, maybe the first hundred times, but eventually, the neurons start to fire together in the right way, the skills are honed, and off you go!
So professors out there, if your students are struggling, even though you've given them what they need to know in a great lecture, and they've got some good books to help them out, and you went over that concept in class 5-6 times, and they asked questions, and it seemed to go really well, realize this - lecture is largely a waste of time. Man, I hate to say it! Partly because I've listened to some really great lectures at times, and really gotten a lot out of them. Instead, or rather in addition, think about what activities you could have them do, what problems you can give them to try and solve, and whatever else you can do to stop being the sage on the stage and start being the guide on the side. Because the good thing is, the students still need you. Student-centered learning doesn't mean that the teacher isn't important, far from it! Figured out a great way to talk about a tough concept? Got a great slide to summarize some complicated processes? Great! Deliver it well! Good lectures are still better than bad ones! But after that, what problems will you give them that will require them to use the information you just presented? What activities will you assign to them, where they apply the lessons learned?
When I first started teaching, this was really hard. What am I going to have them do? Do I have the materials I need? What questions will I ask? A really well developed activity takes a lot of work. To think about the learning goals of the activity, how to immerse the student in the subject, to assemble the right materials and equipment, and to write up a nice looking assignment sheet isn't an easy job. Fortunately, there is the Science Education Resource Center at Carleton College. For many years now, professors from all over have been contributing activities, labs, and other information to the site. I find that for me, the best way to use the site is to follow the Teach the Earth link, and then head to the "Upper Level Geoscience Courses" link, find the course I'm teaching, and start searching from there. There is a wealth of information there, but it isn't always easy to find what you need or what you're looking for even if you know it exists there. But a lot of the stuff submitted is pretty good, and with enough patience I can generally find something that at least sparks an idea in my head. Now that I've done it a few times, it has become much, much easier, to think about, create, and implement good activities, and student learning is increasing.
Teaching has taught me that even the best lecture is largely a waste of time, but working through activities, solving problems, and recreating experiments is time very well spent.

Geoscience news & issues on planet Earth, as well as anything else geological I feel like yabbering about.
Friday, September 30, 2011

Tuesday, September 20, 2011
A Discussion of Peak Oil
A couple of days ago the Wall Street Journal ran an opinion piece stating essentially that all the hype over peak oil is wasted air. Yergin writes with a clear distaste for anything and anyone who has cautioned the world that oil may not last forever or that we ought to be thinking about what to do about that now. Let me right away state my first issue with the article: it is filled with flashy, attention-getting language that is mixed with a fair share of hyperbole and grandstanding. For any of my students out there reading this, when you see language like this, you know one thing: you aren't going to get an analysis that is carefully reasoned, looks fairly at all sides of an issue, and reaches a balanced judgement on the topic at hand. That doesn't mean it doesn't have some good points to make, but it does mean we need to take a careful look at what it has to say.
The idea of "peak oil" is pretty simple - it is the idea that at some point the world will no longer be able to keep up oil production and over the years global production of oil will begin to decline. Pretty much everyone believes this; the debate is always about when that time will come and what a post-peak oil world will look like. The Wikipedia site for Peak Oil is in my opinion quite good on this subject, and another excellent site is The Oil Drum. The idea was put forward by a geologist named Hubbert, who made some calculations about how much oil is possibly recoverable and then made some predictions about how U.S. national oil supplies will trend in the coming decades. He began with the idea of small oil fields, and noticed that in many cases the production of oil from oil fields tends to follow something like a bell-shaped curve (technically it isn't a true bell-shaped curve, but it resembles one). Production is low at first, rises quickly, eventually hits a maximum, and then begins to decline. Within a larger region, the total amount of oil is higher, so the curve has a very similar shape with the difference being that the curve is larger and the peak comes later. Hubbert speculated that since fields of oil and regions of oil fields tend to proceed in this manner, then so will the total amount of oil in a larger area - such as a nation, and eventually the whole planet if we continue to extrapolate. So really it is a matter of scale - small oil fields tend to follow a small bell-shaped curve, larger regions follow a similarly shaped but slightly larger bell-shaped curve, nations and the planet as a whole will likewise follow a similarly shaped but much larger bell-shaped curve. But in each case, a peak in production is reached and production decreases after that.
In the mid-1950's, Hubbert predicted a curve for the United States and stated that the U.S. would achieve peak oil production ~1965-1970, and decline from that point. His prediction has been impressively accurate for actual U.S. oil production. Yergin attempts to downplay this in the WSJ article, focusing on the trees and arguing against the existence of the forest. But it is a simple thing to compare Hubbert's prediction of the U.S. peak with now historical data and see an impressive similarity. U.S. oil production peaked in 1970, and has been in decline since. It has also been applied to numerous other regions and again the fit is often pretty good. In other words, Hubbert's peak is an important concept for us to understand.
In some ways, Yergin is right to critique Hubbert. Hubbert's idea was a simple, starting model. It was a model based primarily on geologic volume of available oil. But the availability of natural resources is not simply due to geologic factors, but also to technological, economic, and political factors. Hubbert didn't include any wiggle room for advancements in technology, which have increased the total amount of recoverable oil from the world's oil fields by a significant percentage. There is no doubt that new technologies have allowed us to find more oil than initially anticipated for various oil fields and regions. These improvements have changed the back end of the curve, so that it doesn't fall as quickly. What this tells us is that the model needs to be updated and improved, not that the model needs to be ridiculed.
Hubbert's idea applied to the planet as a whole also doesn't incorporate economic factors well (really, at all). But neither does Yergin's analysis seem complete here. One problem with applying Hubbert's peak to global oil production is that there is a difference in the relationship between production and price at these different scales. For a small field, when production begins to decline, there is no affect on the price of oil in the global market. Production falls and price is unaffected. This simply cannot translate, however, to the global scale, where decreasing production will have a tremendous impact on price. As global production begins to decline, price generally will increase. As the price increases, demand may decrease and cause the price to fall again, but eventually price & demand will find a new equilibrium as the total supply continues to decrease. The net result generally is that price will rise, but it is buffered by decreasing demand. But a brief history lesson is in order here.
Oil prices, production, and reserves have at times followed a pattern such as this: oil reserves begin to get low, decreased supply causes prices to begin to rise, increased prices lead to increased profits, a portion of profits are re-invested into exploration for new oil fields, new oil fields are discovered, reserves & production increase, and prices then drop again. This scenario played out on a large scale in the 1970's & '80's, when oil jumped from $3/bbl to over $30/bbl in a short decade. But as the price rose, oil companies began spending their money on finding new sources of oil. And they were successful, especially in the North Sea (UK & Norway) and in Mexico, both also important for being non-OPEC nations. As these new discoveries were put into production, reserves and production increased, and price began to fall.
Hence, at times we might think we have reached a global peak in oil production, but the factors surrounding that may lead to new discoveries that in turn cause production to rise again. So that what we thought was the peak, wasn't. And this could certainly happen again. Anyone who's climbed a mountain is familiar with this - often times you think you can see the peak ahead of you, but then you get there and you realize it isn't.
But another point needs to be made that is completely avoided by Yergin: cheap oil is found first, expensive oil is found later. Yergin states that the world has 1.4 trillion bbl of reserves, and another ~3.5 trillion bbls of reserve base, material that is either not economically viable at the present time (i.e., too expensive to get out right now) or material that is not precisely known from a geological standpoint. That 3.5 trillion number by the way is highly controversial. Most of that 3.5 trillion is tied up in very non-conventional sources of oil - tar sands and oil shales. While these do exist, the problem is two-fold: 1) they will require very high prices for oil in order to be possible; and 2) they will require significantly higher impact on the environment in order to extract them. Focusing on #1, what this means is that as we continue to move forward in time, the next oil fields are going to require higher oil prices. As oil production declines and remaining production moves to more and more expensive areas of extraction, price is going to go up. The days of $2/gal gasoline are very likely long gone and aren't coming back, a point that Yergin doesn't bring up. Yes there is potentially still a lot of oil out there, but fewer and fewer people will be able to afford to buy it.
In the end, we must also realize that in such a complex global system involving geology, economics, engineering, technology, & politics, no one is ever going to be able to correctly predict the peak of oil in such a way that all of the rest of us will find it absolutely convincing. There will always be differing opinions on when peak oil will occur. One thing is clear - we aren't going to know when peak oil happens until after it does, and perhaps not even until a decade or more has passed. Only in hindsight will we be able to say when peak oil occurs. The prudent thing then is to make preparations for it earlier rather than later, but currently too few understand the concept and there is no consensus yet on what should be done about it.
The idea of "peak oil" is pretty simple - it is the idea that at some point the world will no longer be able to keep up oil production and over the years global production of oil will begin to decline. Pretty much everyone believes this; the debate is always about when that time will come and what a post-peak oil world will look like. The Wikipedia site for Peak Oil is in my opinion quite good on this subject, and another excellent site is The Oil Drum. The idea was put forward by a geologist named Hubbert, who made some calculations about how much oil is possibly recoverable and then made some predictions about how U.S. national oil supplies will trend in the coming decades. He began with the idea of small oil fields, and noticed that in many cases the production of oil from oil fields tends to follow something like a bell-shaped curve (technically it isn't a true bell-shaped curve, but it resembles one). Production is low at first, rises quickly, eventually hits a maximum, and then begins to decline. Within a larger region, the total amount of oil is higher, so the curve has a very similar shape with the difference being that the curve is larger and the peak comes later. Hubbert speculated that since fields of oil and regions of oil fields tend to proceed in this manner, then so will the total amount of oil in a larger area - such as a nation, and eventually the whole planet if we continue to extrapolate. So really it is a matter of scale - small oil fields tend to follow a small bell-shaped curve, larger regions follow a similarly shaped but slightly larger bell-shaped curve, nations and the planet as a whole will likewise follow a similarly shaped but much larger bell-shaped curve. But in each case, a peak in production is reached and production decreases after that.
In the mid-1950's, Hubbert predicted a curve for the United States and stated that the U.S. would achieve peak oil production ~1965-1970, and decline from that point. His prediction has been impressively accurate for actual U.S. oil production. Yergin attempts to downplay this in the WSJ article, focusing on the trees and arguing against the existence of the forest. But it is a simple thing to compare Hubbert's prediction of the U.S. peak with now historical data and see an impressive similarity. U.S. oil production peaked in 1970, and has been in decline since. It has also been applied to numerous other regions and again the fit is often pretty good. In other words, Hubbert's peak is an important concept for us to understand.
In some ways, Yergin is right to critique Hubbert. Hubbert's idea was a simple, starting model. It was a model based primarily on geologic volume of available oil. But the availability of natural resources is not simply due to geologic factors, but also to technological, economic, and political factors. Hubbert didn't include any wiggle room for advancements in technology, which have increased the total amount of recoverable oil from the world's oil fields by a significant percentage. There is no doubt that new technologies have allowed us to find more oil than initially anticipated for various oil fields and regions. These improvements have changed the back end of the curve, so that it doesn't fall as quickly. What this tells us is that the model needs to be updated and improved, not that the model needs to be ridiculed.
Hubbert's idea applied to the planet as a whole also doesn't incorporate economic factors well (really, at all). But neither does Yergin's analysis seem complete here. One problem with applying Hubbert's peak to global oil production is that there is a difference in the relationship between production and price at these different scales. For a small field, when production begins to decline, there is no affect on the price of oil in the global market. Production falls and price is unaffected. This simply cannot translate, however, to the global scale, where decreasing production will have a tremendous impact on price. As global production begins to decline, price generally will increase. As the price increases, demand may decrease and cause the price to fall again, but eventually price & demand will find a new equilibrium as the total supply continues to decrease. The net result generally is that price will rise, but it is buffered by decreasing demand. But a brief history lesson is in order here.
Oil prices, production, and reserves have at times followed a pattern such as this: oil reserves begin to get low, decreased supply causes prices to begin to rise, increased prices lead to increased profits, a portion of profits are re-invested into exploration for new oil fields, new oil fields are discovered, reserves & production increase, and prices then drop again. This scenario played out on a large scale in the 1970's & '80's, when oil jumped from $3/bbl to over $30/bbl in a short decade. But as the price rose, oil companies began spending their money on finding new sources of oil. And they were successful, especially in the North Sea (UK & Norway) and in Mexico, both also important for being non-OPEC nations. As these new discoveries were put into production, reserves and production increased, and price began to fall.
Hence, at times we might think we have reached a global peak in oil production, but the factors surrounding that may lead to new discoveries that in turn cause production to rise again. So that what we thought was the peak, wasn't. And this could certainly happen again. Anyone who's climbed a mountain is familiar with this - often times you think you can see the peak ahead of you, but then you get there and you realize it isn't.
But another point needs to be made that is completely avoided by Yergin: cheap oil is found first, expensive oil is found later. Yergin states that the world has 1.4 trillion bbl of reserves, and another ~3.5 trillion bbls of reserve base, material that is either not economically viable at the present time (i.e., too expensive to get out right now) or material that is not precisely known from a geological standpoint. That 3.5 trillion number by the way is highly controversial. Most of that 3.5 trillion is tied up in very non-conventional sources of oil - tar sands and oil shales. While these do exist, the problem is two-fold: 1) they will require very high prices for oil in order to be possible; and 2) they will require significantly higher impact on the environment in order to extract them. Focusing on #1, what this means is that as we continue to move forward in time, the next oil fields are going to require higher oil prices. As oil production declines and remaining production moves to more and more expensive areas of extraction, price is going to go up. The days of $2/gal gasoline are very likely long gone and aren't coming back, a point that Yergin doesn't bring up. Yes there is potentially still a lot of oil out there, but fewer and fewer people will be able to afford to buy it.
In the end, we must also realize that in such a complex global system involving geology, economics, engineering, technology, & politics, no one is ever going to be able to correctly predict the peak of oil in such a way that all of the rest of us will find it absolutely convincing. There will always be differing opinions on when peak oil will occur. One thing is clear - we aren't going to know when peak oil happens until after it does, and perhaps not even until a decade or more has passed. Only in hindsight will we be able to say when peak oil occurs. The prudent thing then is to make preparations for it earlier rather than later, but currently too few understand the concept and there is no consensus yet on what should be done about it.
Thursday, September 15, 2011
Earth Sci Pic of the Day
Well I'm thrilled to report that the photo of Diamond Head Crater I shared here a couple of weeks ago was selected to be the Earth Science Picture of the Day for today! If you missed it, here is my post about the picture from a couple of weeks ago.
Monday, September 5, 2011
GeoTech Review: USGS WaterAlert service
This past week on Thursday, Sept. 1st, the USGS tweeted out the following:
"Smart Phones Know When Rivers Rise...with USGS WaterAlert http://bit.ly/nVhJFU #usgsnews"
Introduction
The link takes you here: http://www.usgs.gov/newsroom/article.asp?ID=2919 to the USGS news release page, which describes the release of a new service called WaterAlert. I assumed from the tweet that the announcement was for a smart phone app, the kind of thing people download on their android or iphone that uses the capabilities of portable computing. My mind immediately started thinking of the potentials for combining real-time and historical stream data with all the functionality that comes with a smartphone or tablet, such as an app that shows stream gage height and discharge data, options for "nearby my location" and "search any location", a map view with interactive capabilities, some flood stage warnings/notifications, perhaps some water level & quality forecasts (floods do eventually move downstream, after all), and maybe even some way to work in links to pictures or videos. That could be pretty cool! That capability would be very useful for scientists & people in the media out in the field, especially when rivers are rising past flood stage and people or property are potentially in danger.
You Know What Happens When You Assume
Unfortunately that's not quite where we're at. The WaterAlert service doesn't require a smartphone, in fact it doesn't even require a phone at all for using the service. To sign up, you click over to http://water.usgs.gov/wateralert/, which is linked in the instructions given in the link above. This page takes a bit of time to load. The service requires that you choose a single, specific USGS river gage site, and then it will either send you a text to your phone or send you an email based on your preference. There are several other options to choose from, such as whether you'll get hourly or daily notifications, whether you'd like gage height or discharge data (apparently you can't get both, in a single notification, however), and you can set it so that you only receive these notifications if the data reach parameters you set, such as above or below a certain value, inbetween values, etc. You get to pick what you want those parameters to be, so to test it out I chose to get notifications when discharge was between 1 and 100,000 cfs for a couple of sites on a fairly large river nearby.
Subscribing to the System
To choose a site at the WaterAlert website, you must first select a state from a list on the left. There is a map in the center of the page showing the locations of thousands of USGS StreamGage sites in the U.S., but it isn't clickable, at least not at first. Once you click on a state and on a data type (surface water, groundwater, water quality, or precipitation), then the map zooms to that dataset (e.g., all IL surface water sites) and becomes interactive. The map is based on googlemaps and so has much of the typical functionality (zooming, panning, and basemap types). If you select a new state, it will jump to it and show the stations there. If you zoom back out, the map will still show the stations for the first state you chose as clickable options, so you can see the stations for a large number of states at a time if you like. However, it will only show one data type at a time - clicking on "Groundwater" after first choosing "Surface Water" will change all the icons in all the states you've clicked on from surface water to ground water, and so on. At this point, if you mouseover a data station on the map, you'll get an info box showing the name of the station. Clicking on a station gets you a larger pop-out box that shows the name of the site, the USGS Site Number, and most recent discharge and gage height data. There is a box at the bottom of the call-out window to subscribe to the data from that site.
Clicking on the subscribe requires that you allow a pop-up borwser window, which brings up the subscription form. There you enter your email address, phone# if you prefer text messages, and set your preferences for recieving the data. The first thing you get is an email that you must respond to in order to confirm your subscription, even if you only want text messages, which is typical protocol for most any internet service you want to sign up for.
A major limitation of the service is that you have to submit a subscription to every single data site that you are interested in. If you want stream gage height data for 3 locations, you'll need to submit 3 subscriptions and confirm each one. If you want water quality data or information on groundwater, those are different subscriptions. The problem is obvious - if you really want to follow what's going on in a region, you're going to need a whole lot of subscriptions.
Notifications by Text and Email
A short time after confirming my subscriptions, I got my first text from wateralert@usgs.gov. I then got another 19 minutes later; not sure why the second was necessary, but after that the messages started coming either every hour or every 24 hours, depending on the settings. But, all of the text messages for a single subscription are the same - you get a link. I was surprised to see that there wasn't any actual data contained within the text message. The link takes you to a USGS WaterAlert Help page. Even here, there was no data! It shows your subscription information, a link to the real time data for the site you've chosen, and a number of "help" links/info for modifying your subscription. This help page includes your cell number listed on it, with your provider info, otherwise I'd show you a link to see what the page looks like. When you click on the realtime data link, you'll get a gage site specific page such as this one: http://waterdata.usgs.gov/nwis/uv/?site_no=05520500. By default, it shows all the data for the site (in this case both discharge and gage height) for the past 7 days in a couple of graphs.
But there is an obvious problem - if you don't have internet access and a web browser on your phone, the link doesn't do you much good. So the text messages really are only good for smart phones and feature phones that minimally have access to websites. This isn't at all obvious from the sign-up page! If the text messages contained the actual data that you've subscribed to, then you could use this service on any cell phone that allows text messaging.
If on the other hand you choose to get email notifications, then it is a bit different. The email message contains actual data - essentially the measurement you requested (e.g., streamflow of 77 cfs) as well as the subscription limits that you set, the time & date of the current measurement, the stream gage number and name, and your notification interval. It also contains a link for the real time data at the specific station, just like the link shown above, as well as some help links.
Final Thoughts
Now let me first say that I think the USGS is a great organization and it is one that I think is woefully underfunded. I'm a big fan of the USGS and what they do.
But the bottom line is that this system wasn't nearly as useful or interesting as I had hoped it would be. The text notifications aren't terribly useful, especially not every hour since the text simply sends you the same link, over and over, every hour. Once you've got the link from one text message, you can simply check it as often as you like and there is no need to receive the same link as a text every hour or even every day. The email notifications are more useful since it sends actual data. But, as is evident from my description of the service above, there aren't a lot of bells and whistles here to get really excited about, and this could clutter up your inbox pretty quickly. It could be useful if you want to be notified when a stream reaches flood stage, because you could set the parameters so that you only get notifications when gage height or discharge reach those values. But if you really want to know what's going on with the water in an area of interest, probably the best thing to do is still go directly to the USGS website at http://waterdata.usgs.gov/nwis/rt and surf around the various gage sites to gather the information you want.
I'm hopeful that at some point someone will write an application for smart phones that can retrieve the data and organize it in a map format so that it can be more easily seen at a glance. Until then....
"Smart Phones Know When Rivers Rise...with USGS WaterAlert http://bit.ly/nVhJFU #usgsnews"
Introduction
The link takes you here: http://www.usgs.gov/newsroom/article.asp?ID=2919 to the USGS news release page, which describes the release of a new service called WaterAlert. I assumed from the tweet that the announcement was for a smart phone app, the kind of thing people download on their android or iphone that uses the capabilities of portable computing. My mind immediately started thinking of the potentials for combining real-time and historical stream data with all the functionality that comes with a smartphone or tablet, such as an app that shows stream gage height and discharge data, options for "nearby my location" and "search any location", a map view with interactive capabilities, some flood stage warnings/notifications, perhaps some water level & quality forecasts (floods do eventually move downstream, after all), and maybe even some way to work in links to pictures or videos. That could be pretty cool! That capability would be very useful for scientists & people in the media out in the field, especially when rivers are rising past flood stage and people or property are potentially in danger.
You Know What Happens When You Assume
Unfortunately that's not quite where we're at. The WaterAlert service doesn't require a smartphone, in fact it doesn't even require a phone at all for using the service. To sign up, you click over to http://water.usgs.gov/wateralert/, which is linked in the instructions given in the link above. This page takes a bit of time to load. The service requires that you choose a single, specific USGS river gage site, and then it will either send you a text to your phone or send you an email based on your preference. There are several other options to choose from, such as whether you'll get hourly or daily notifications, whether you'd like gage height or discharge data (apparently you can't get both, in a single notification, however), and you can set it so that you only receive these notifications if the data reach parameters you set, such as above or below a certain value, inbetween values, etc. You get to pick what you want those parameters to be, so to test it out I chose to get notifications when discharge was between 1 and 100,000 cfs for a couple of sites on a fairly large river nearby.
Subscribing to the System
To choose a site at the WaterAlert website, you must first select a state from a list on the left. There is a map in the center of the page showing the locations of thousands of USGS StreamGage sites in the U.S., but it isn't clickable, at least not at first. Once you click on a state and on a data type (surface water, groundwater, water quality, or precipitation), then the map zooms to that dataset (e.g., all IL surface water sites) and becomes interactive. The map is based on googlemaps and so has much of the typical functionality (zooming, panning, and basemap types). If you select a new state, it will jump to it and show the stations there. If you zoom back out, the map will still show the stations for the first state you chose as clickable options, so you can see the stations for a large number of states at a time if you like. However, it will only show one data type at a time - clicking on "Groundwater" after first choosing "Surface Water" will change all the icons in all the states you've clicked on from surface water to ground water, and so on. At this point, if you mouseover a data station on the map, you'll get an info box showing the name of the station. Clicking on a station gets you a larger pop-out box that shows the name of the site, the USGS Site Number, and most recent discharge and gage height data. There is a box at the bottom of the call-out window to subscribe to the data from that site.
Clicking on the subscribe requires that you allow a pop-up borwser window, which brings up the subscription form. There you enter your email address, phone# if you prefer text messages, and set your preferences for recieving the data. The first thing you get is an email that you must respond to in order to confirm your subscription, even if you only want text messages, which is typical protocol for most any internet service you want to sign up for.
A major limitation of the service is that you have to submit a subscription to every single data site that you are interested in. If you want stream gage height data for 3 locations, you'll need to submit 3 subscriptions and confirm each one. If you want water quality data or information on groundwater, those are different subscriptions. The problem is obvious - if you really want to follow what's going on in a region, you're going to need a whole lot of subscriptions.
Notifications by Text and Email
A short time after confirming my subscriptions, I got my first text from wateralert@usgs.gov. I then got another 19 minutes later; not sure why the second was necessary, but after that the messages started coming either every hour or every 24 hours, depending on the settings. But, all of the text messages for a single subscription are the same - you get a link. I was surprised to see that there wasn't any actual data contained within the text message. The link takes you to a USGS WaterAlert Help page. Even here, there was no data! It shows your subscription information, a link to the real time data for the site you've chosen, and a number of "help" links/info for modifying your subscription. This help page includes your cell number listed on it, with your provider info, otherwise I'd show you a link to see what the page looks like. When you click on the realtime data link, you'll get a gage site specific page such as this one: http://waterdata.usgs.gov/nwis/uv/?site_no=05520500. By default, it shows all the data for the site (in this case both discharge and gage height) for the past 7 days in a couple of graphs.
But there is an obvious problem - if you don't have internet access and a web browser on your phone, the link doesn't do you much good. So the text messages really are only good for smart phones and feature phones that minimally have access to websites. This isn't at all obvious from the sign-up page! If the text messages contained the actual data that you've subscribed to, then you could use this service on any cell phone that allows text messaging.
If on the other hand you choose to get email notifications, then it is a bit different. The email message contains actual data - essentially the measurement you requested (e.g., streamflow of 77 cfs) as well as the subscription limits that you set, the time & date of the current measurement, the stream gage number and name, and your notification interval. It also contains a link for the real time data at the specific station, just like the link shown above, as well as some help links.
Final Thoughts
Now let me first say that I think the USGS is a great organization and it is one that I think is woefully underfunded. I'm a big fan of the USGS and what they do.
But the bottom line is that this system wasn't nearly as useful or interesting as I had hoped it would be. The text notifications aren't terribly useful, especially not every hour since the text simply sends you the same link, over and over, every hour. Once you've got the link from one text message, you can simply check it as often as you like and there is no need to receive the same link as a text every hour or even every day. The email notifications are more useful since it sends actual data. But, as is evident from my description of the service above, there aren't a lot of bells and whistles here to get really excited about, and this could clutter up your inbox pretty quickly. It could be useful if you want to be notified when a stream reaches flood stage, because you could set the parameters so that you only get notifications when gage height or discharge reach those values. But if you really want to know what's going on with the water in an area of interest, probably the best thing to do is still go directly to the USGS website at http://waterdata.usgs.gov/nwis/rt and surf around the various gage sites to gather the information you want.
I'm hopeful that at some point someone will write an application for smart phones that can retrieve the data and organize it in a map format so that it can be more easily seen at a glance. Until then....
Monday, August 29, 2011
The Mountain Cannot Bow To It
I've always been drawn to mountains. As a kid I lived in western Washington and could see Mt. Rainier in the distance on any clear day. It was always stunning, and awesome. As a geologist, I've spent my professional time studying the tectonic and geochemical processes involved when mountains are built up and eroded back down. Obviously geoscientists have a thing for mountains; they are fantastic and reveal their secrets only after copious amounts of time in the field and lab.
Beyond the scientific interest, however, it seems that mountains have always held an allure to people. People have found ways to relate them to their lives. So in this post, I'm taking a step away from the science and even the just fun geoscience related stuff to write something a bit more from a literary, life, and character standpoint. References to mountains pervade our culture (speaking as an English-speaking white person from a wealthy western nation), and not just ours but also the cultures of many people groups throughout geography and history, space and time. Mountains are often used as literary references for various principles in life. Things we love, admire, respect, and fear. Things we must overcome, or things that might protect us, or perhaps things that might bring terror down upon us.
Beyond the scientific interest, however, it seems that mountains have always held an allure to people. People have found ways to relate them to their lives. So in this post, I'm taking a step away from the science and even the just fun geoscience related stuff to write something a bit more from a literary, life, and character standpoint. References to mountains pervade our culture (speaking as an English-speaking white person from a wealthy western nation), and not just ours but also the cultures of many people groups throughout geography and history, space and time. Mountains are often used as literary references for various principles in life. Things we love, admire, respect, and fear. Things we must overcome, or things that might protect us, or perhaps things that might bring terror down upon us.
One of my favorite references to mountains comes from the Disney movie 'Mulan'. In one critical scene of the story, there's this fantastic 'kneel before zod' movie moment, where the antagonist warrior Shan-Yu orders the Emperor of China, "Bow to me!". The Emperor holds his cool, and in strength-of-the-man-of-steel fashion calmly replies:
"No matter how the wind howls, the mountain cannot bow to it."
I love the emperor's clarity, tenacity, and boldness. It's one of those story moments where, although he clearly does not possess the physical strength to overcome the snarling warrior, nonetheless he possesses a strength of character that somehow makes up for the gross difference in physical power. Here, the mountain represents strength, endurance, and steadfastness in the face of the threat. Life is full of people who howl like some awful bag of wind, crying to us that we bend to their demands. You see, if you're a tree, you may stand up to the wind, you may not. You may end up getting blown over when some wind-bag suggests you compromise your ethics so whatever-it-is on the job-site will have an easier go, never-mind the risks or who might get hurt. But if you're a mountain, well, you simply can't.
Friday, August 26, 2011
Accretionary Wedge #37: Sexy Geology: Bancroft, Ontario
For the first time in this blog, I've decided to join a host of other geobloggers in the geoblog carnival, which is aptly named The Accretionary Wedge. This time around, Lockwood at Outside the Interzone has called for posts around the topic "Sexy Geology", described as geology that makes you heart race and your pupils dilate.
In thinking about what to contribute many places came to mind, but in the end so many of them are found near a magical place called Bancroft, Ontario. Bancroft is a small town that is world renowned for its mineral specimens. It is the "Mineral Capital of Canada", due to the great allure of the area to rockhounds and mineral collectors, who are drawn there not only for the vast number of minerals that can be found but also the quality of specimens in size and shape. Of the ~4000 known minerals, at least 1600 are known in the Bancroft area, some sources have said the number is even higher.
There are way too many sites around Bancroft to really give a full account; I'll highlight just a few of my very favorites:
1) Egan Chutes Provincial Park at the York River:
This locality includes several stops on both sides of the York River-
The Goulding-Keane Nepheline Pegamtite Quarry (N 45° 04.201’, W 077° 43.947’) is an abandoned small quarry with easily seen large crystals of magmatic nepheline, biotite, calcite, sodalite, and zircon. The zircons are large enough to be seen in hand specimen! This quarry is the source of the large dump of crushed rock in the center of town (N 45° 03.432’, W 077° 51.379’), where rockhounds can pick through these rocks and take what they like.
Continuing down the trail from the G-K quarry, you'll reach the main chute, where the river pinches down at a terrific waterfall (N 45° 04.473’, W 077° 44.081’). The nepheline gneisses here also contain diopside, scapolite, hornblende, plagioclase, and at one point in time contained sapphire (but the larger samples have all been removed).
Heading back, across the York River from the G-K quarry mentioned above lies the York River Skarn (N 45° 04.210, W 077° 43.914’). The unaltered marble can be seen in a roadcut (N 45° 04.066’, W 077° 43.874’) just before the trail to get to the skarn, which is good to visit before seeing the skarn to truly appreciate the changes that took place in these rocks as the nepheline pegmatite intruded (and it has some spectacular sigma clasts). At the skarn, about 50 minerals have been described at this single outcrop, including garnet, diopside, wollastonite, vesuvianite, forsterite, clinohumite, spinel, clintonite (a green, Ca-mica), among many others.
2) MacDonald Mine:
This is an old uranium mine in a granite pegmatite (N 45° 09.928', W 077° 49.189'), dominated by GIANT K-feldspar & quartz crystals. Some of the K-spar crystals are ~10' long, and some quartz grains are the size of beach balls. Much of the quartz is dark & smokey, due to the presence of the uranium ore mineral, uranian pyrochlore ("ellsworthite"). The pyrochlore grains themselves are typically round & ~4 inches in diameter. And they are HOT. They will send your Geiger counter into awesome mode. Also present are andradite (black Fe+3-rich garnet), sphene, and zircon. As an American, it is really surprising to be able to freely enter a place like this; in the U.S. this mine would be surrounded by 20' tall fences, barbed wire, and very large guards with very large dogs and guns; the size of the KEEP OUT signs would reach epic proportions. But here in Bancroft, you can just park at N 45° 09.846’, W 077° 49.160’ and hike in.
3) Orange Calcite Roadcut:
Along Monck Road, a cut at the top of a small hill (N 45° 00.169’, W 078° 00.360’) displays some fascinating rocks with orange calcite and large grains of white tremolite. Several grains of a highly radioactive mineral I have yet to identify are present here, which are easily found with a Geiger counter as they set it on fire.
4) Green Mantle Farm Eco-Tour:
If you have the time, and really, you should make it, there is no substitute for taking a tour with Mark Bramham through his property and adjacent Crown land to see some truly fantastic mineral specimens in the wooded areas surrounding his home (N 45° 00.663', W 078° 14.903'). No sample collecting is allowed, but you won't regret going. Let me just say "fluororichterite stream". Richterite is an amphibole like tremolite, but substitute 2 Na+ for Ca+2, and the richterite here contains significant fluorine for the OH- group. There are very few places in the world where fluororichterite is known, so your choices for viewing it are limited.
You'll also see gorgeous GIANT euhedral hornblende, orthoclase, green apatite, and museum quality red clinohumite. The tour lasts 2.5-3 hours, and their playful dogs add to the charm of this wooded walk. Although he's sitting on a mineralogical gold mine, Mark's passion for conservation is inspiring. Besides the material found on his own property, He has used the mining law to stake a claim on the adjacent Crown land so that he could protect the minerals and keep them in their natural place for future generations to see.
So there you have it, my take on Sexy Geology, with a virtual visit to Bancroft, Ontario. And this is but a small slice of what is available in this area!
In thinking about what to contribute many places came to mind, but in the end so many of them are found near a magical place called Bancroft, Ontario. Bancroft is a small town that is world renowned for its mineral specimens. It is the "Mineral Capital of Canada", due to the great allure of the area to rockhounds and mineral collectors, who are drawn there not only for the vast number of minerals that can be found but also the quality of specimens in size and shape. Of the ~4000 known minerals, at least 1600 are known in the Bancroft area, some sources have said the number is even higher.
There are way too many sites around Bancroft to really give a full account; I'll highlight just a few of my very favorites:
1) Egan Chutes Provincial Park at the York River:
This locality includes several stops on both sides of the York River-
The Goulding-Keane Nepheline Pegamtite Quarry (N 45° 04.201’, W 077° 43.947’) is an abandoned small quarry with easily seen large crystals of magmatic nepheline, biotite, calcite, sodalite, and zircon. The zircons are large enough to be seen in hand specimen! This quarry is the source of the large dump of crushed rock in the center of town (N 45° 03.432’, W 077° 51.379’), where rockhounds can pick through these rocks and take what they like.
Continuing down the trail from the G-K quarry, you'll reach the main chute, where the river pinches down at a terrific waterfall (N 45° 04.473’, W 077° 44.081’). The nepheline gneisses here also contain diopside, scapolite, hornblende, plagioclase, and at one point in time contained sapphire (but the larger samples have all been removed).
 |
| Egan Chute Falls |
2) MacDonald Mine:
This is an old uranium mine in a granite pegmatite (N 45° 09.928', W 077° 49.189'), dominated by GIANT K-feldspar & quartz crystals. Some of the K-spar crystals are ~10' long, and some quartz grains are the size of beach balls. Much of the quartz is dark & smokey, due to the presence of the uranium ore mineral, uranian pyrochlore ("ellsworthite"). The pyrochlore grains themselves are typically round & ~4 inches in diameter. And they are HOT. They will send your Geiger counter into awesome mode. Also present are andradite (black Fe+3-rich garnet), sphene, and zircon. As an American, it is really surprising to be able to freely enter a place like this; in the U.S. this mine would be surrounded by 20' tall fences, barbed wire, and very large guards with very large dogs and guns; the size of the KEEP OUT signs would reach epic proportions. But here in Bancroft, you can just park at N 45° 09.846’, W 077° 49.160’ and hike in.
3) Orange Calcite Roadcut:
Along Monck Road, a cut at the top of a small hill (N 45° 00.169’, W 078° 00.360’) displays some fascinating rocks with orange calcite and large grains of white tremolite. Several grains of a highly radioactive mineral I have yet to identify are present here, which are easily found with a Geiger counter as they set it on fire.
 |
| orange calcite and large white fibers of tremolite |
4) Green Mantle Farm Eco-Tour:
If you have the time, and really, you should make it, there is no substitute for taking a tour with Mark Bramham through his property and adjacent Crown land to see some truly fantastic mineral specimens in the wooded areas surrounding his home (N 45° 00.663', W 078° 14.903'). No sample collecting is allowed, but you won't regret going. Let me just say "fluororichterite stream". Richterite is an amphibole like tremolite, but substitute 2 Na+ for Ca+2, and the richterite here contains significant fluorine for the OH- group. There are very few places in the world where fluororichterite is known, so your choices for viewing it are limited.
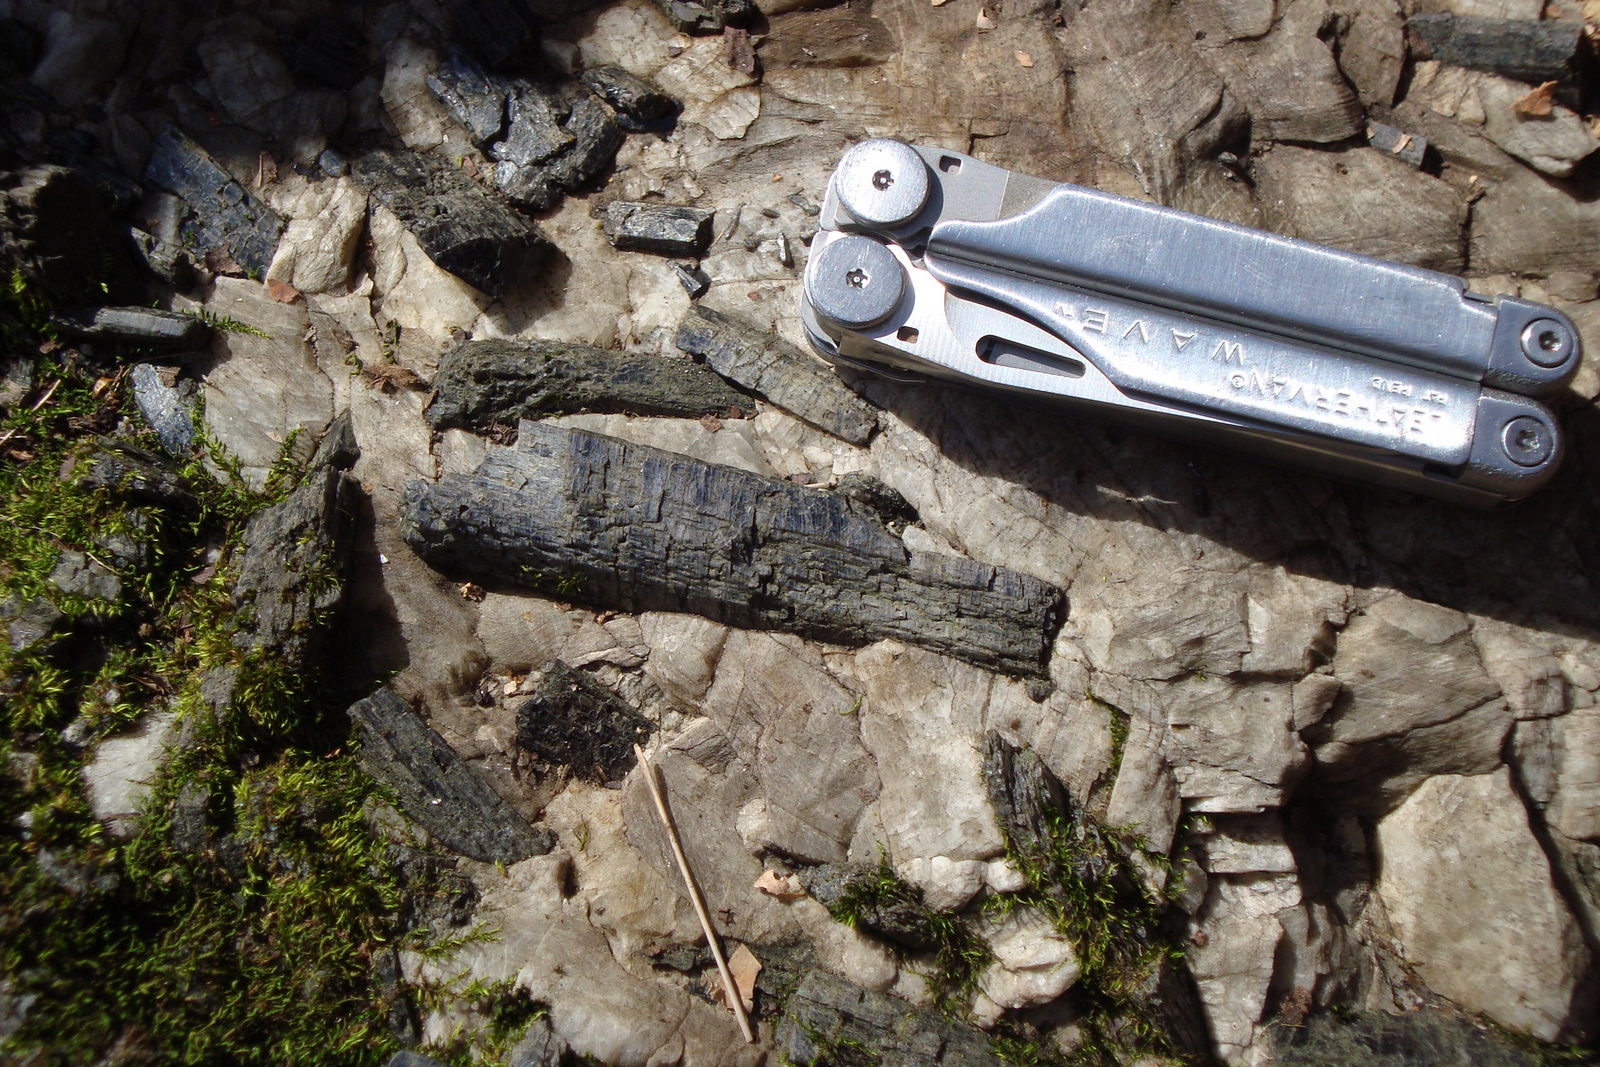 |
| Large dark green crystals of fluororichterite |
 |
| Euhedral hornblende crystals |
 |
| Euhedral orthoclase crystals |
So there you have it, my take on Sexy Geology, with a virtual visit to Bancroft, Ontario. And this is but a small slice of what is available in this area!
Friday, August 19, 2011
GeoPic: Diamond Head Crater
I readily admit I'm not a great photographer, but occasionally I get a shot worth sharing. Here's a picture I took of Diamond Head Crater while on vacation in Hawaii.

The shot was taken from an aircraft (obviously); we were on a commercial flight from Honolulu to Hilo. I had a window seat and was looking north. The clouds parted just perfectly for a moment and I was able to get this shot. My wife and I had just climbed Diamond Head a day or two before, but seeing it from the air was really stunning.
Diamond Head crater is interesting geologically because the volcanic eruptions from this crater, and a number of others like it on Oahu, are much younger than the rest of the island. Most people are aware, I hope anyway, that the Hawaiian Islands were formed as the Pacific plate moved across the top of a hot spot. The hot spot is still active today, producing volcanism on the Big Island. Most of the volcanic rocks of Oahu are between 2-4 million years old. Oahu is now over 200 miles from Kilauea, and the age of the island is consistent with the modern tectonic rate of movement of the Pacific plate at around 9 cm/year. But Diamond Head and a number of other volcanic craters are much younger, less than 500 thousand years old. By this point, Oahu was well beyond the hot spot, and most of Oahu had been undergoing erosion for over a million and a half years! So based on all of this, these young volcanic craters on Oahu are very strange - if Oahu was not over the top of the hot spot anymore, why were these volcanoes erupting? This is a point of current research & debate among geoscientists.

The shot was taken from an aircraft (obviously); we were on a commercial flight from Honolulu to Hilo. I had a window seat and was looking north. The clouds parted just perfectly for a moment and I was able to get this shot. My wife and I had just climbed Diamond Head a day or two before, but seeing it from the air was really stunning.
Diamond Head crater is interesting geologically because the volcanic eruptions from this crater, and a number of others like it on Oahu, are much younger than the rest of the island. Most people are aware, I hope anyway, that the Hawaiian Islands were formed as the Pacific plate moved across the top of a hot spot. The hot spot is still active today, producing volcanism on the Big Island. Most of the volcanic rocks of Oahu are between 2-4 million years old. Oahu is now over 200 miles from Kilauea, and the age of the island is consistent with the modern tectonic rate of movement of the Pacific plate at around 9 cm/year. But Diamond Head and a number of other volcanic craters are much younger, less than 500 thousand years old. By this point, Oahu was well beyond the hot spot, and most of Oahu had been undergoing erosion for over a million and a half years! So based on all of this, these young volcanic craters on Oahu are very strange - if Oahu was not over the top of the hot spot anymore, why were these volcanoes erupting? This is a point of current research & debate among geoscientists.
Subscribe to:
Posts (Atom)